Section 2.3.1: Product report
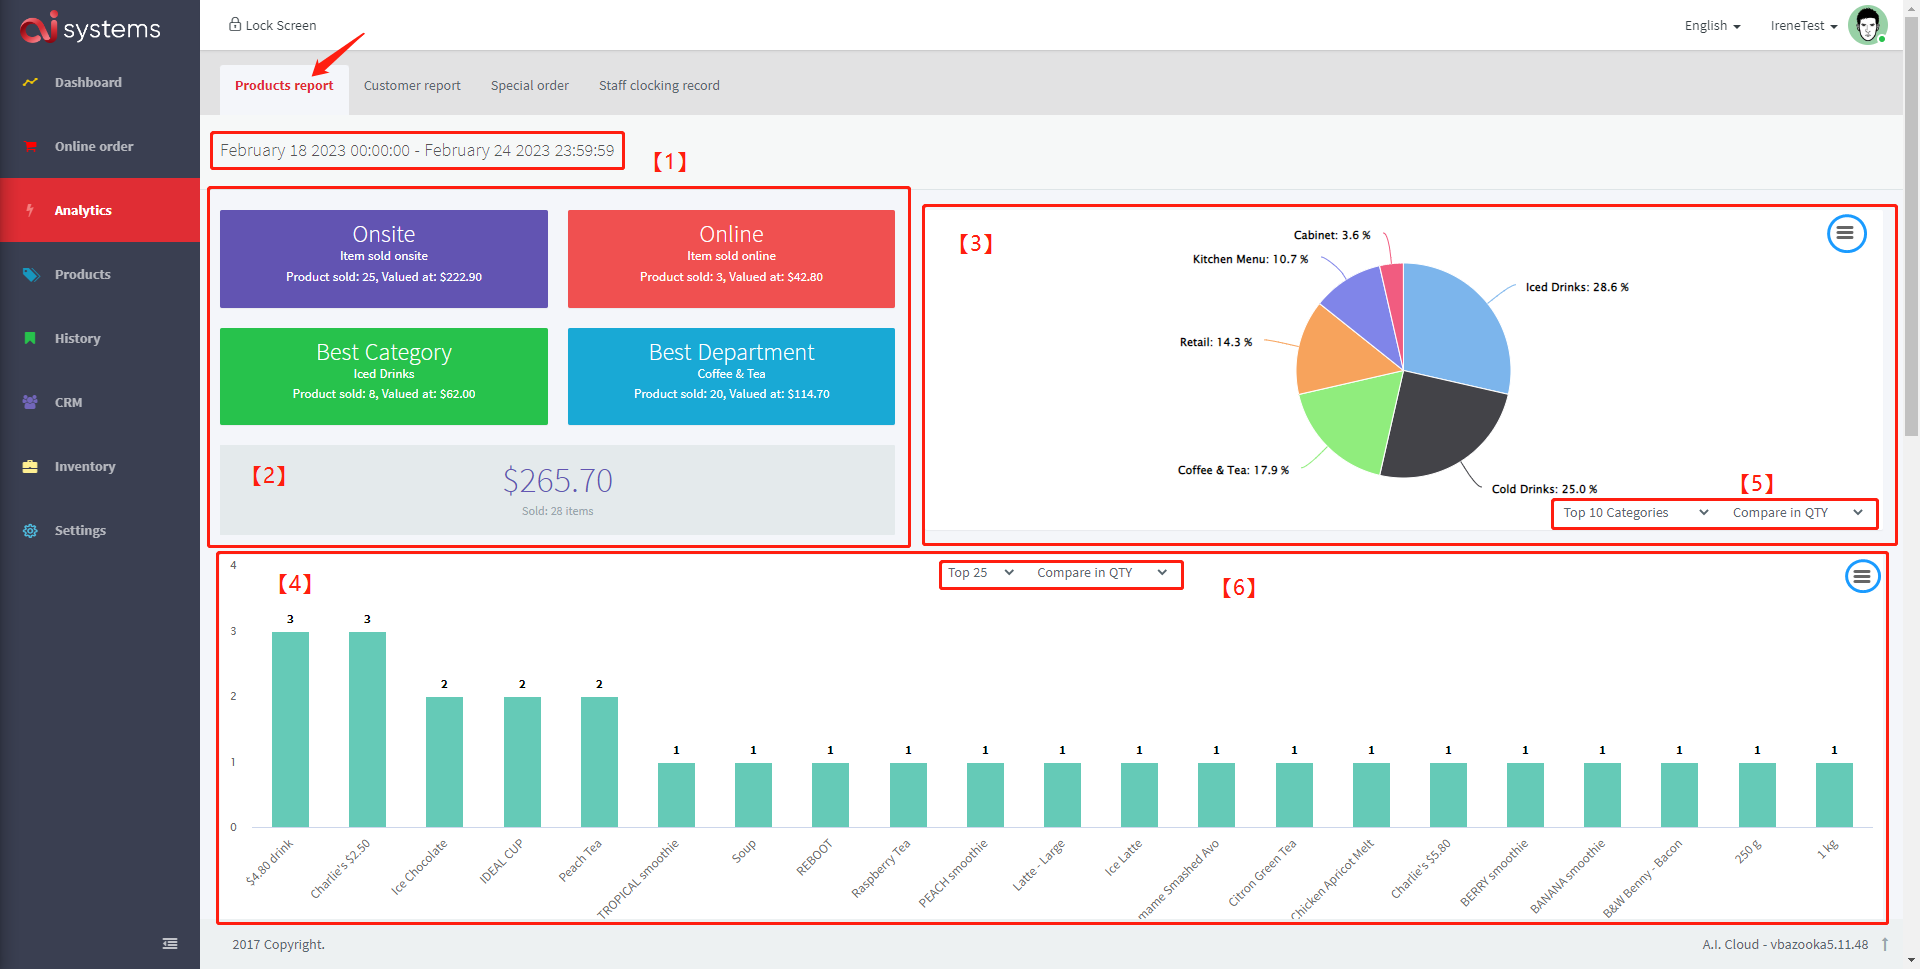
1. You can modify the date interval here. There are some convenient options for dates or you can just customize the date interval. When you need to customize it, you need to select the exact start and end date. Finally, please click 'Apply'.
2. The total sales for the selected time interval are shown here. It also shows the sales data generated through different platforms, listing the best selling categories and departments.
3. Some of the best-selling categories/departments are shown here in the form of bar charts. If you place your mouse over one of the bars, it will display the number and value of sales in this category/department.
4. Some of the best selling products are shown here in the form of histograms.
5. Here you can choose between categories or departments, or you can choose to make a comparison of quantities or values.
6. Here you can choose the top 25 or top 50 products, or you can choose to make a comparison of quantity or value.
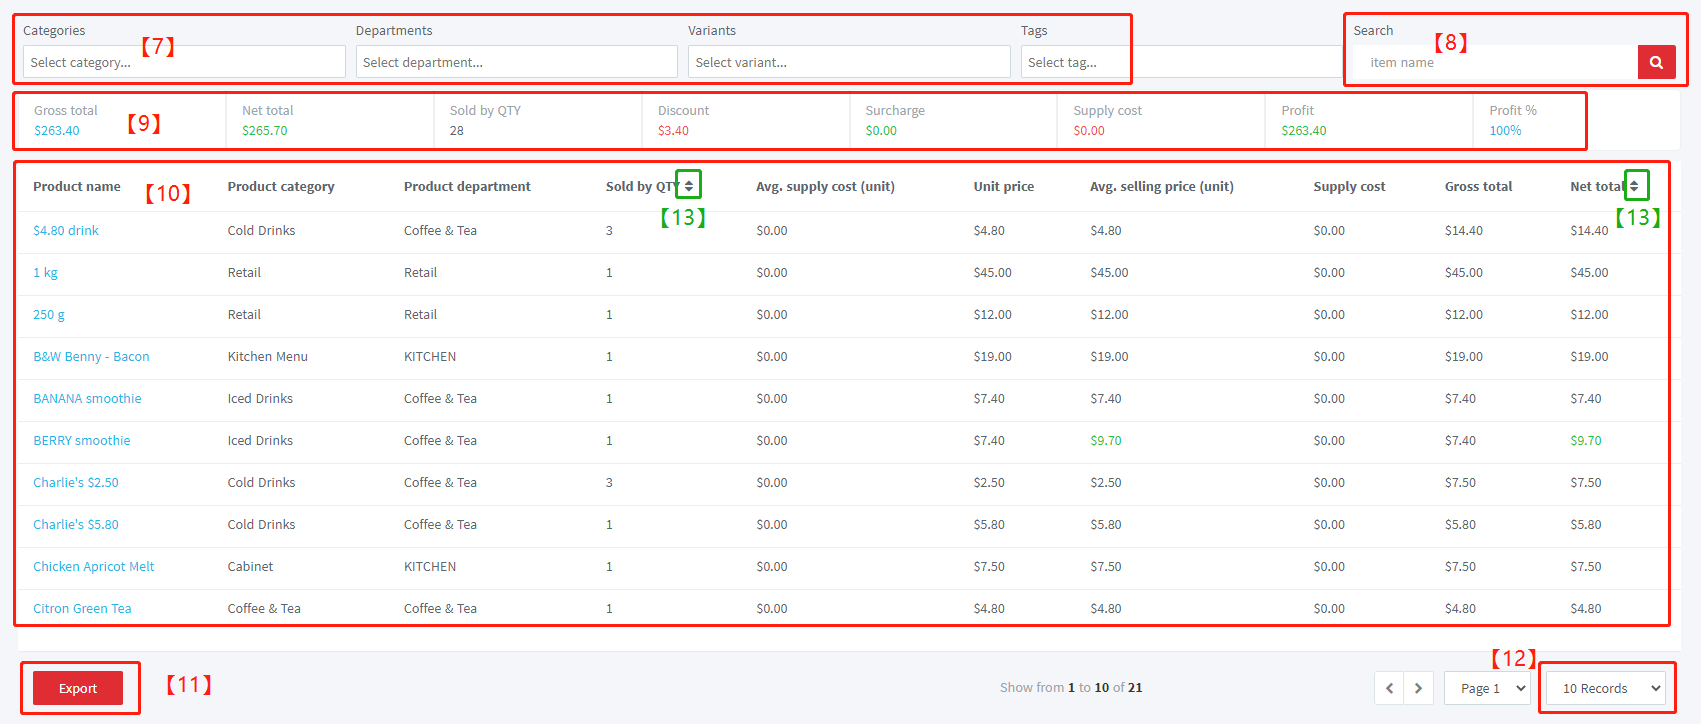
7. Filter field.
8. Search bar.
9. A summary of the various amounts used for analysis.
10. A table showing the sales details of selected products.
11. Export to a csv file.
12. Select the number of products to be recorded on a single page.
13. Convenient sorting of columns.
Section 2.3.2: Customer report
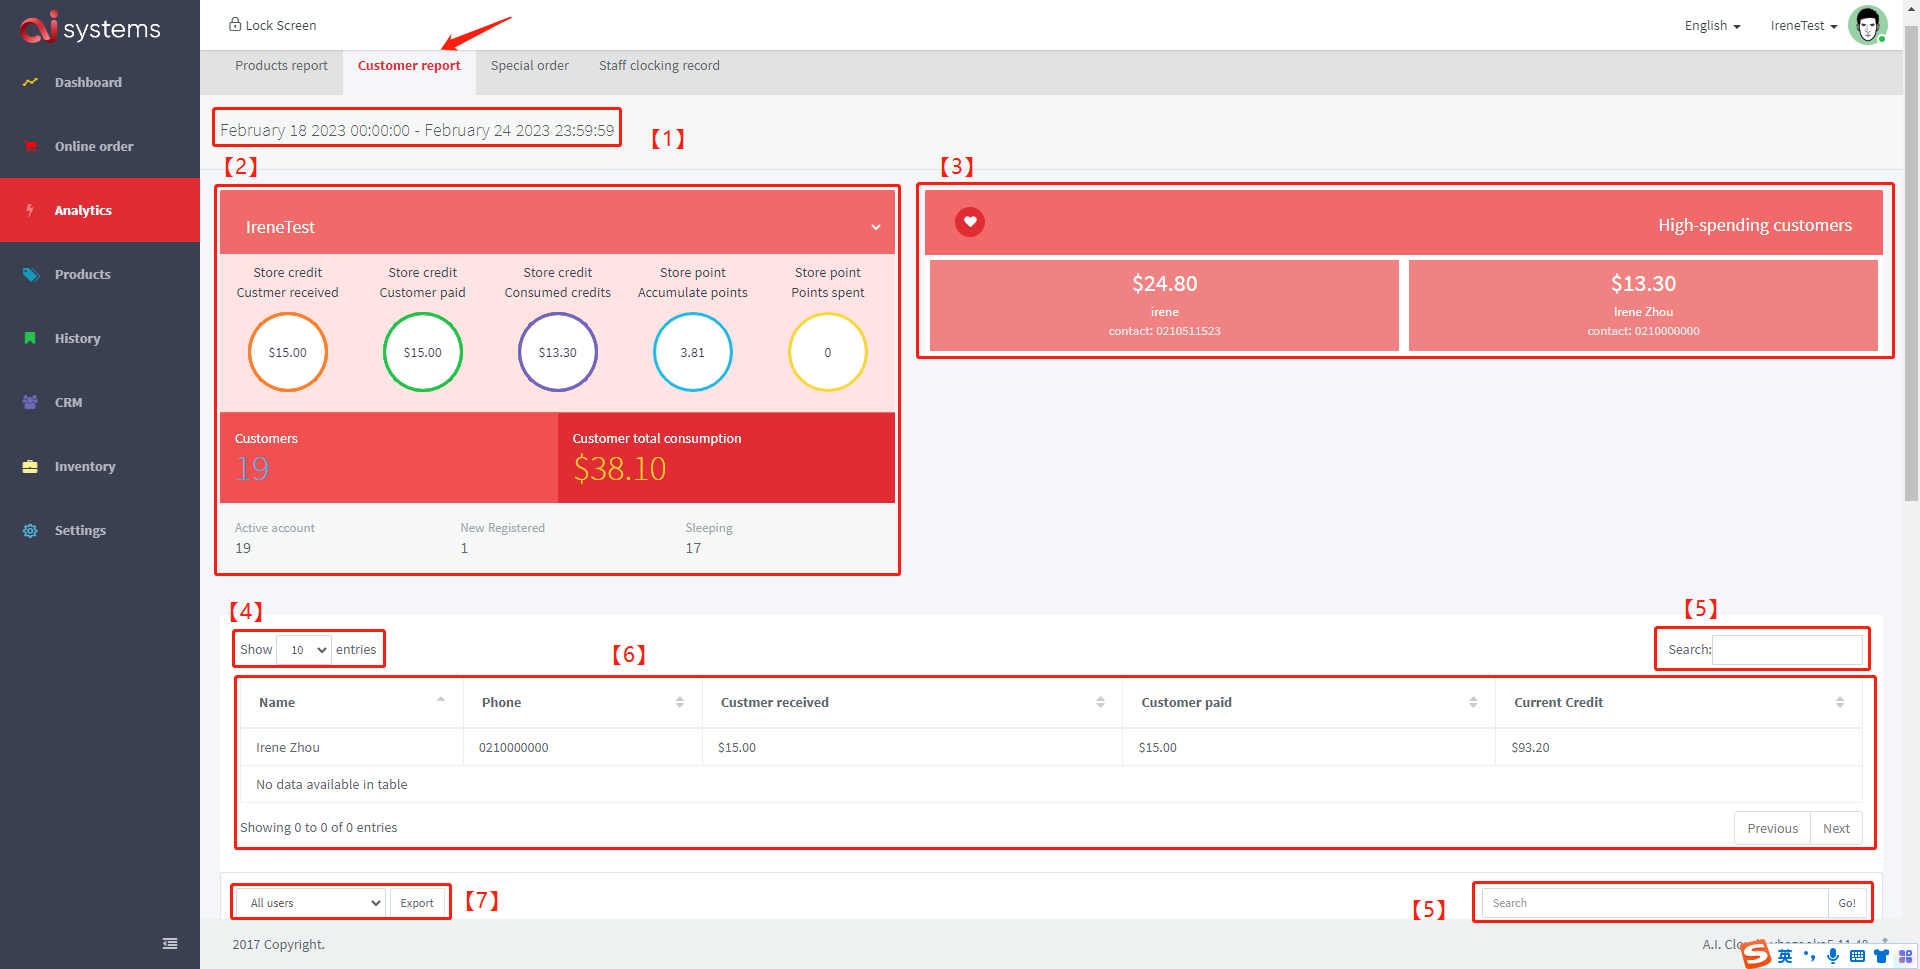
1. You can modify the date interval here. There are some convenient options for dates or you can just customize the date interval. When you need to customize it, you need to select the exact start and end date, and the exact time. Finally, please click 'Apply'.
2. The amount associated with the store credit is displayed. The total number of customers and the total amount spent by members are counted. Even active and sleeping users are shown.
3. The information of high-spending customers.
4. Select the number of customers to be showed on a single page.
5. Search bar.
6. The table shows the information of customers who made recharges during the selected time.
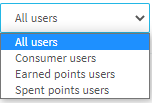
7. Filter field and export button.
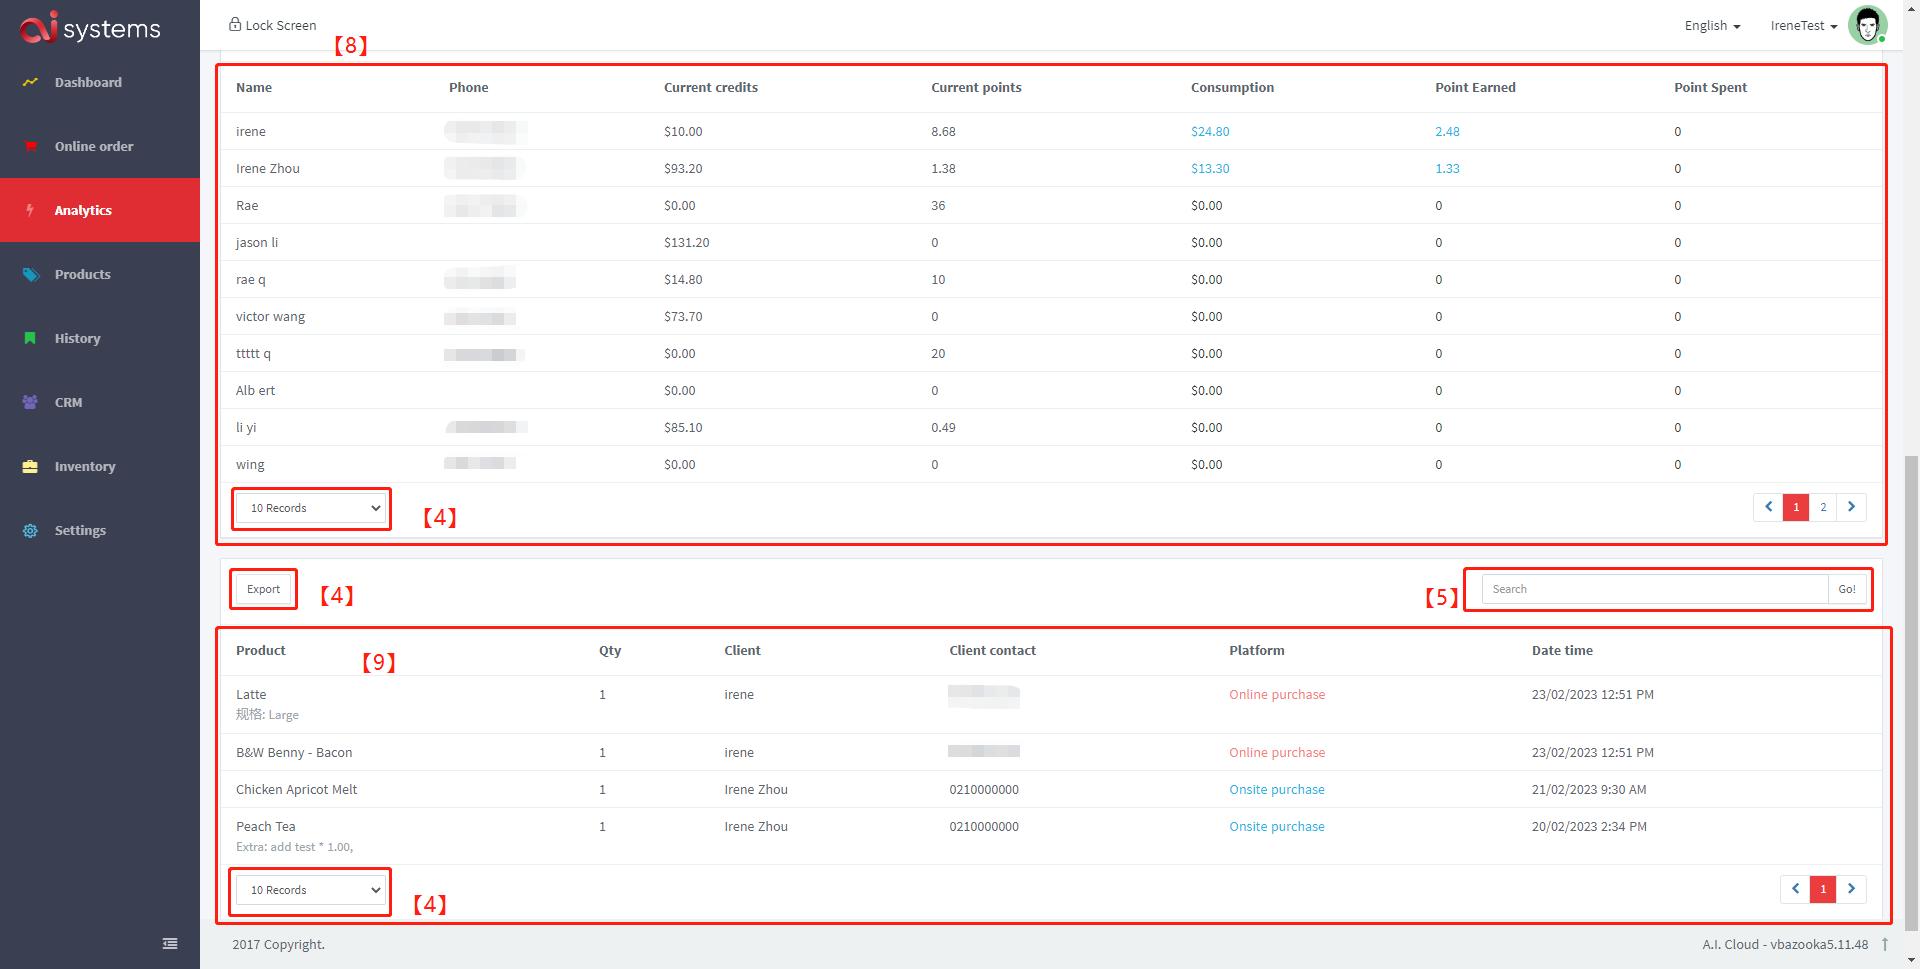
8. This area displays the dynamics and details of the store account information for the selected range of customers.
9. This area displays the dynamics of the customer's credit usage for the selected time period.
Section 2.3.3: Special order
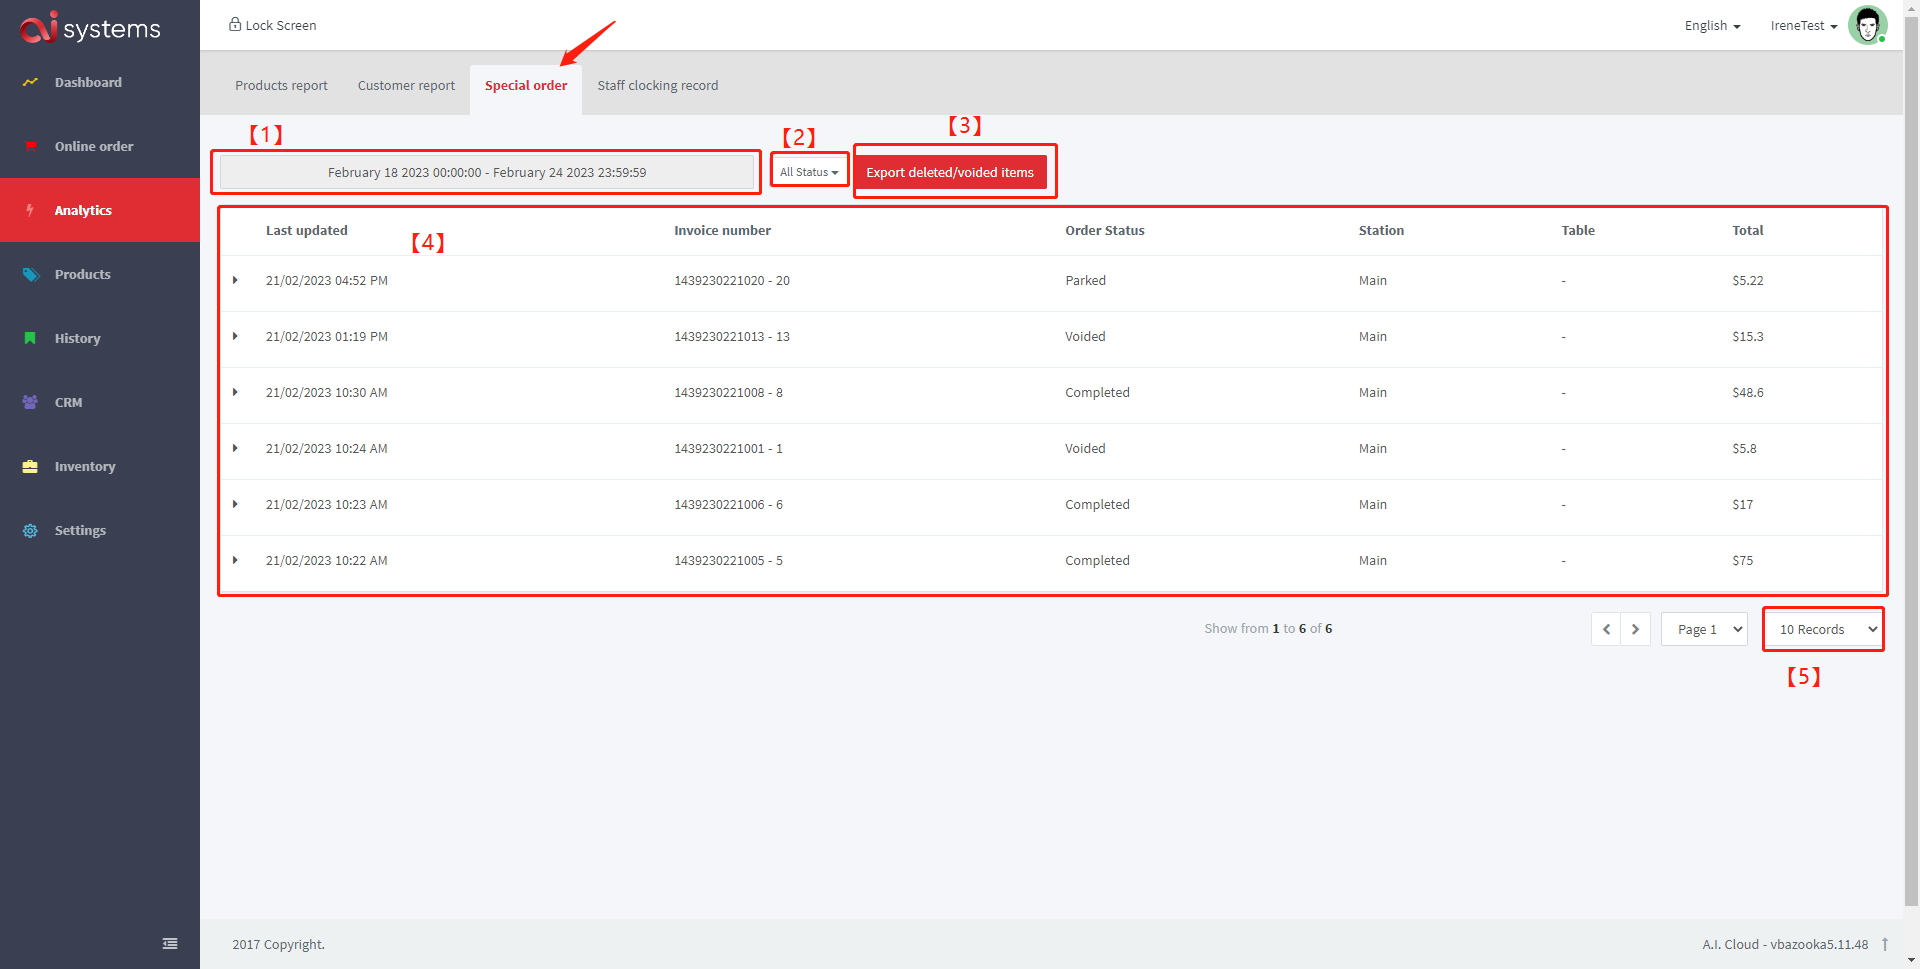
1. You can modify the date interval here. There are some convenient options for dates or you can just customize the date interval. When you need to customize it, you need to select the exact start and end date, and the exact time. Finally, please click 'Apply'.
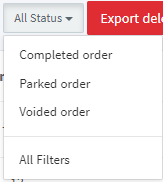
2. Filter field.
3. Export deleted/voided items to a csv file.
4. This area displays special orders for the selected time period. By clicking on the triangle in front of each order, you can see the order details as well as the special order type.
5. Select the number of orders to be showed on a single page.
Section 2.3.4: Staff clocking record
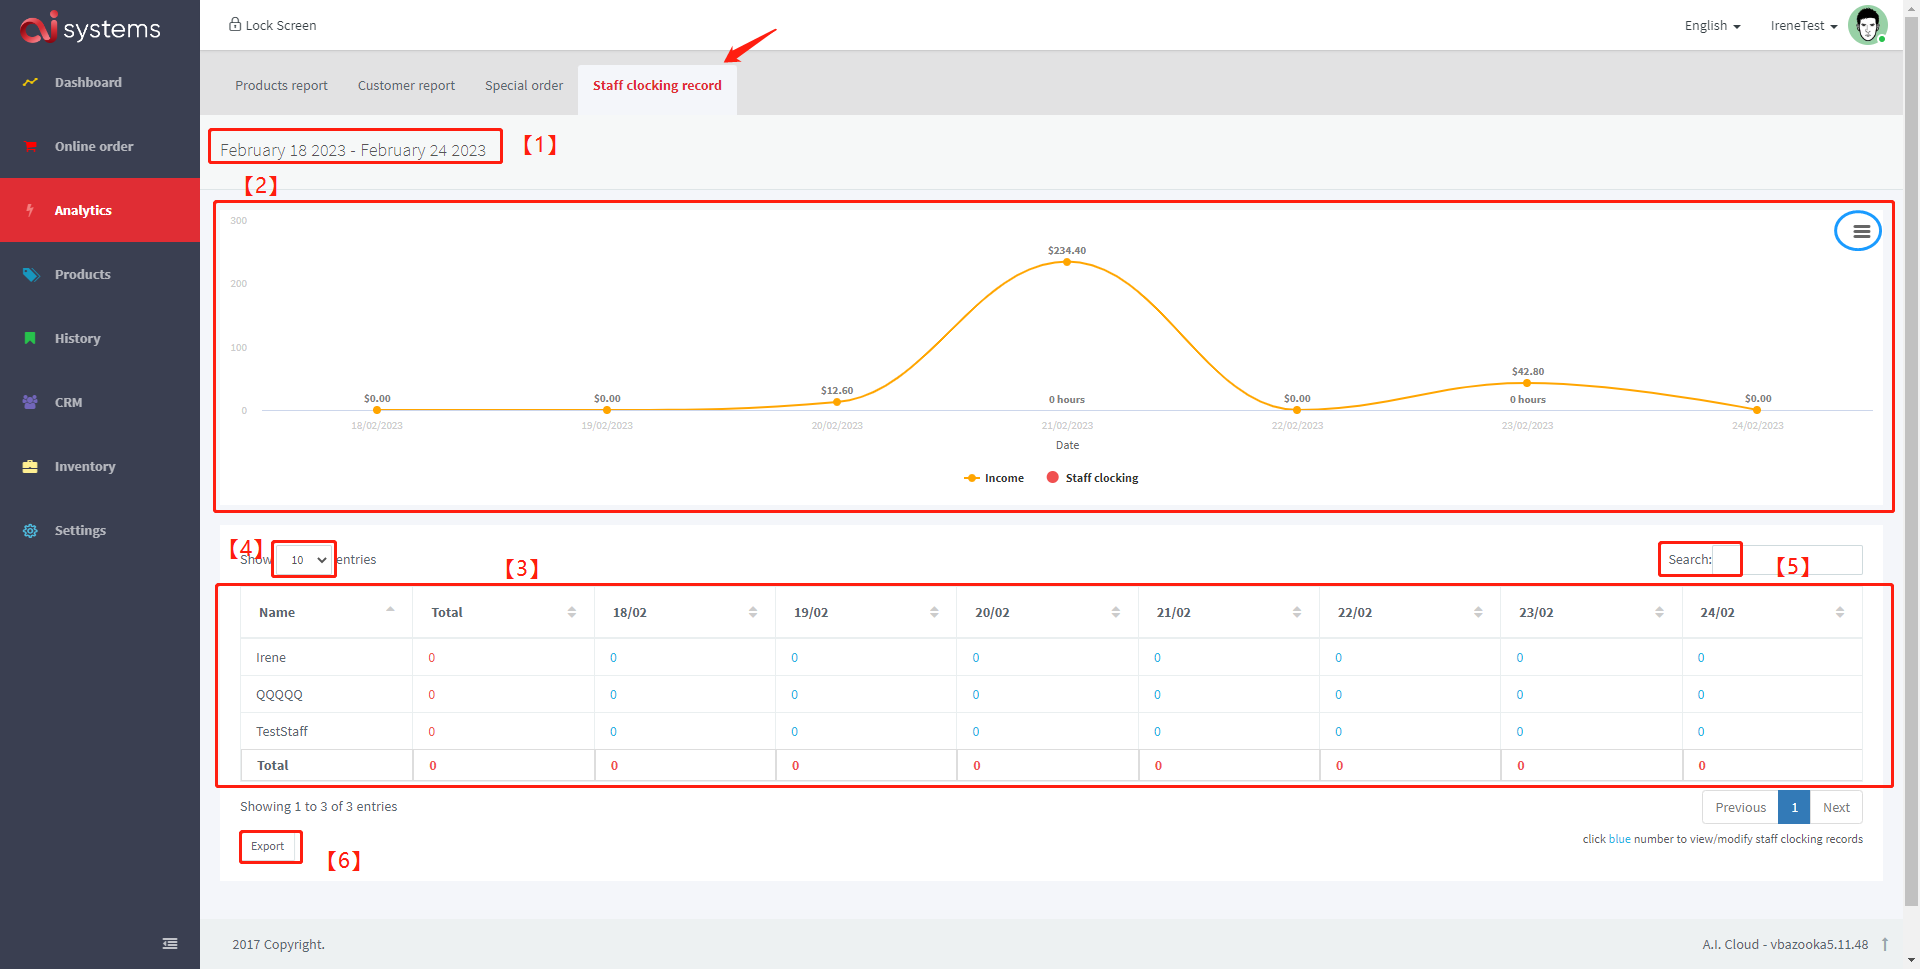
1. You can modify the date interval here. There are some convenient options for dates or you can just customize the date interval. When you need to customize it, you need to select the exact start and end date. Finally, please click 'Apply'.
2. This composite graph shows the daily income and daily staff clock hours for the selected time period.
3. This table shows the details of the staff clock hours for the selected time period.
4. Select the number of staff to be showed on a single page.
5. Search bar.
6. Export button.