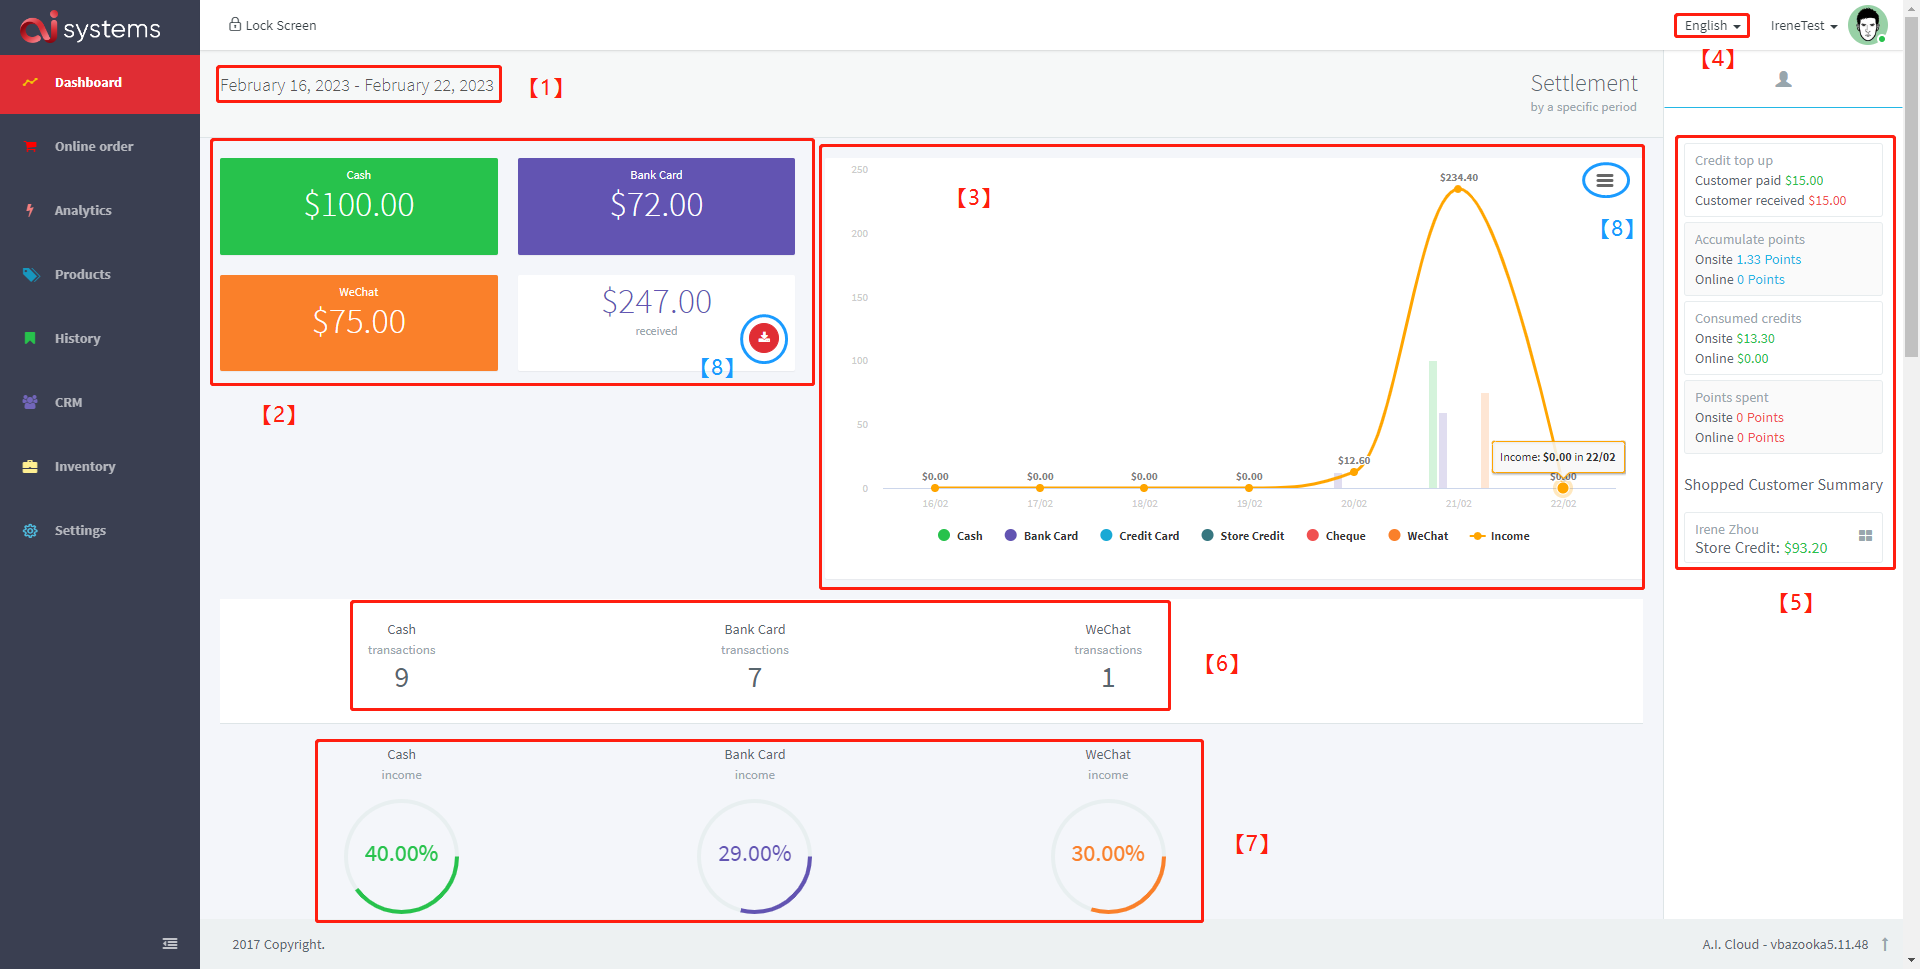
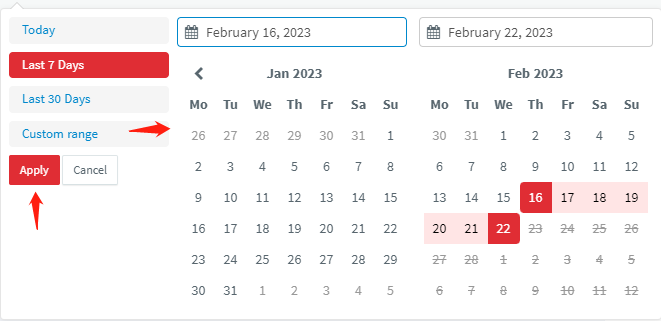
1. You can modify the date interval here. There are some convenient options for dates or you can just customize the date interval. When you need to customize it, you need to select the exact start and end date. Finally, please click 'Apply'.
2. This area shows the amount received by each different payment method during the selected time interval and the total amount in real time.
3. This area shows a line graph of the fluctuation of the total daily revenue for the selected time interval, with a detailed histogram of the different payment methods.
4. Here you can change the language of the backend site, English or Simplified Chinese.
5. This area displays details and summaries related to the customer's membership card for the selected time interval. You can clearly see here the amount of money recharged and the usage within the customer's membership card.
6. This area shows the number of successful orders transacted by different payment methods in the selected time interval.
7. This area shows the percentage of successful orders transacted by different payment methods in the selected time interval.
8. All the places circled in blue on this page are available for downloading the relevant content, even in different format options.
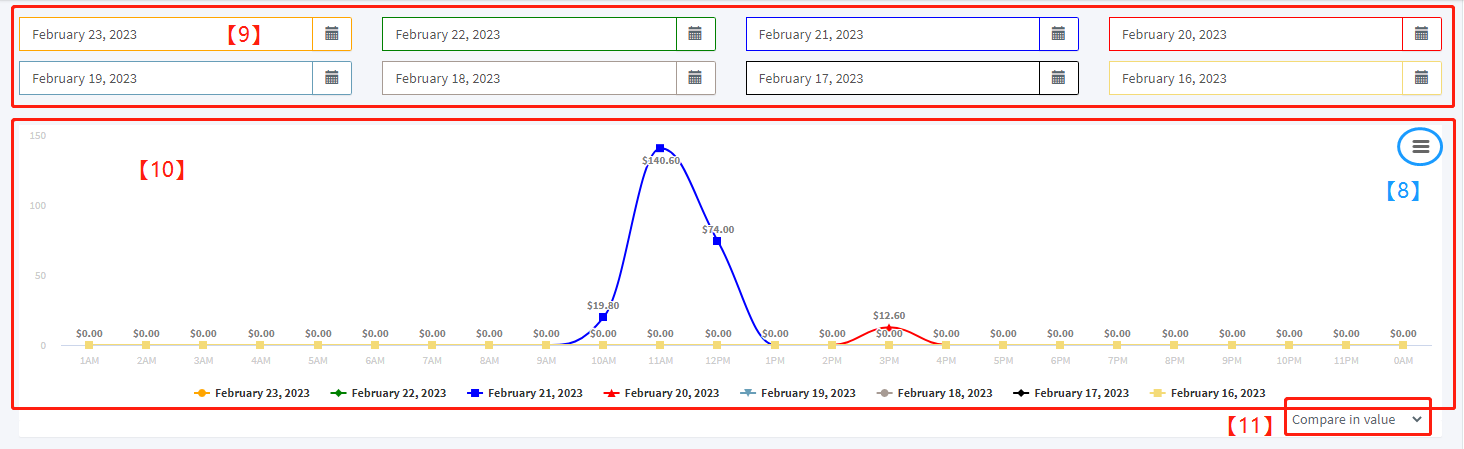
9. In this area you can choose any 8 days for a detailed comparison of turnover for analysis.
10. This area displays a line graph of turnover for the selected 8 days. This graph can be accurate to the hour.
11. This area allows you to change the vertical units of the graph and compare both VALUE and QUANTITY.
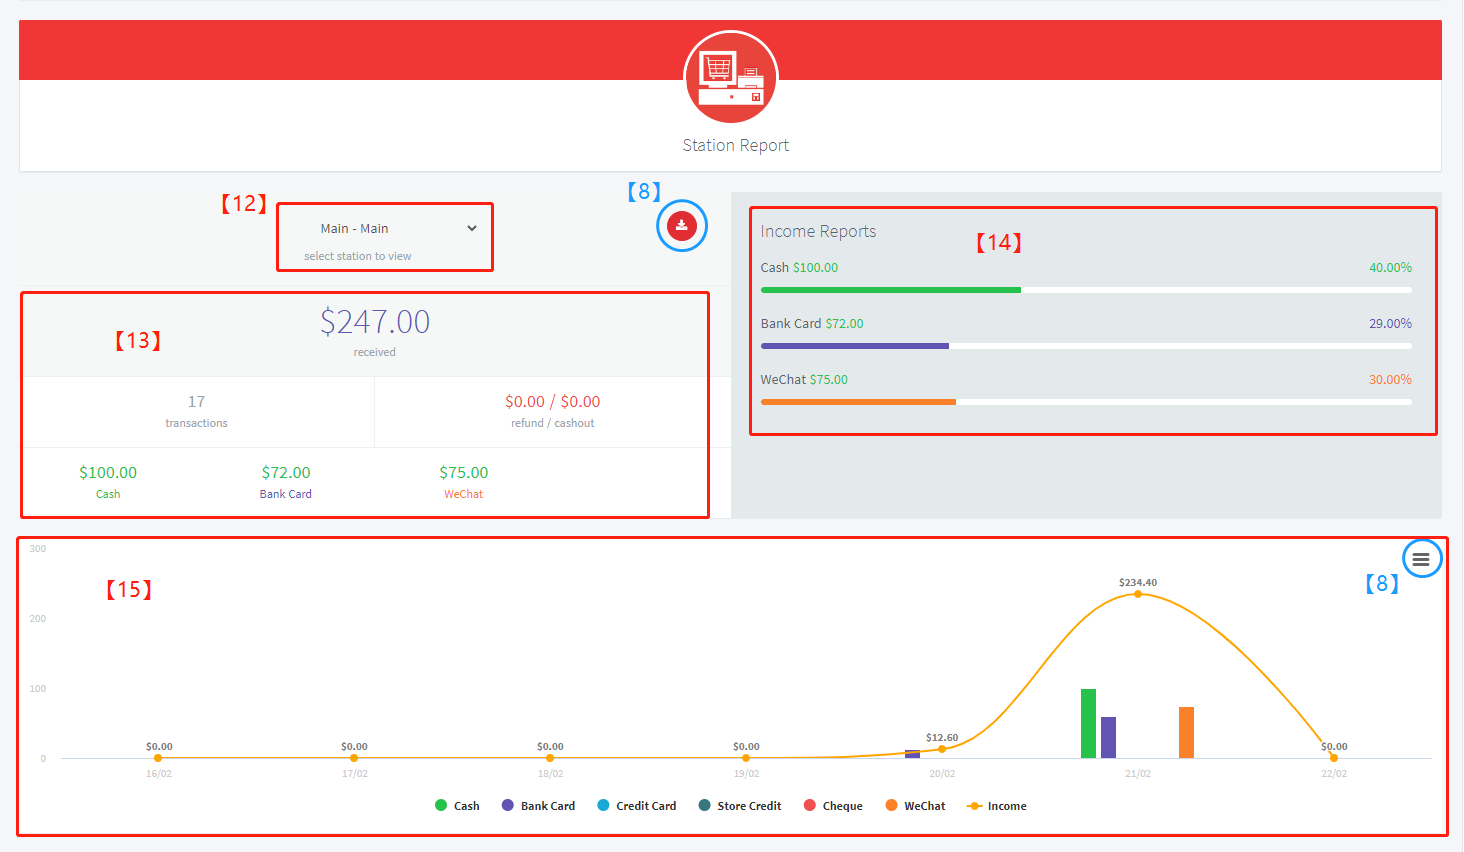
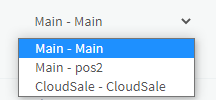
12. In this area you can select a specific POS or online site for cashier analysis.
13. Records of the total amount actually received and records of the number of transactions. The amount of refunds or cash out and the amount received by each payment method can also be displayed here.
14. This is the income report, i.e. it shows the percentage of the amount received with each payment method.
15. This area shows a line graph of the fluctuation of the total daily revenue for the selected time interval, with a detailed histogram of the different payment methods. Same as 3.
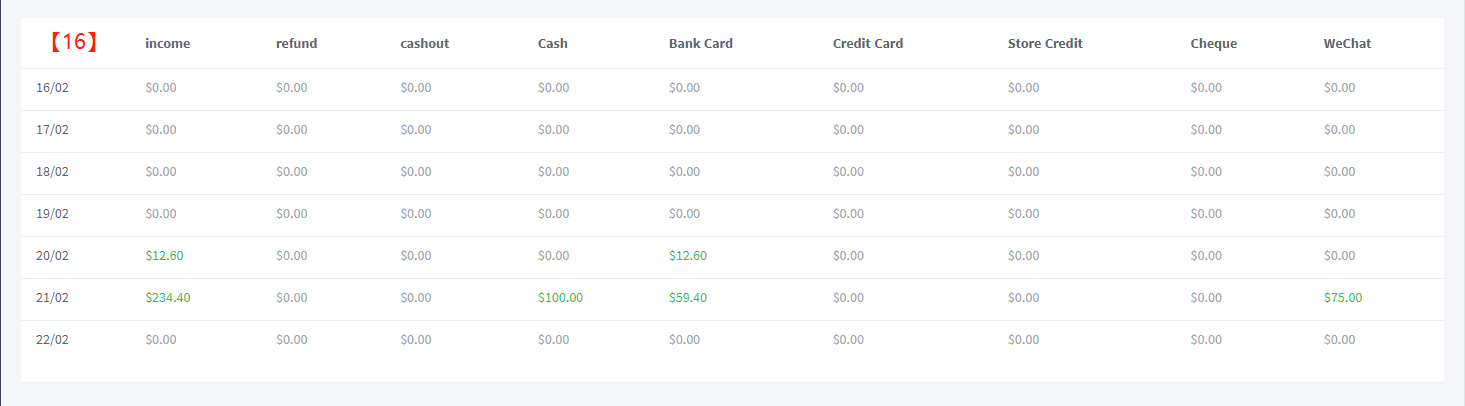
16. This table provides a more detailed and complete record of income for the date selected.